If you’ve been anywhere near the world of graph making in the past several years, at some point someone probably sent you the Data Visualization Checklist, developed first in 2014 by me and Ann Emery. We built the checklist based on the best available research I was seeing via…
data visualization checklist
Guest Post – Charting Confidence Intervals
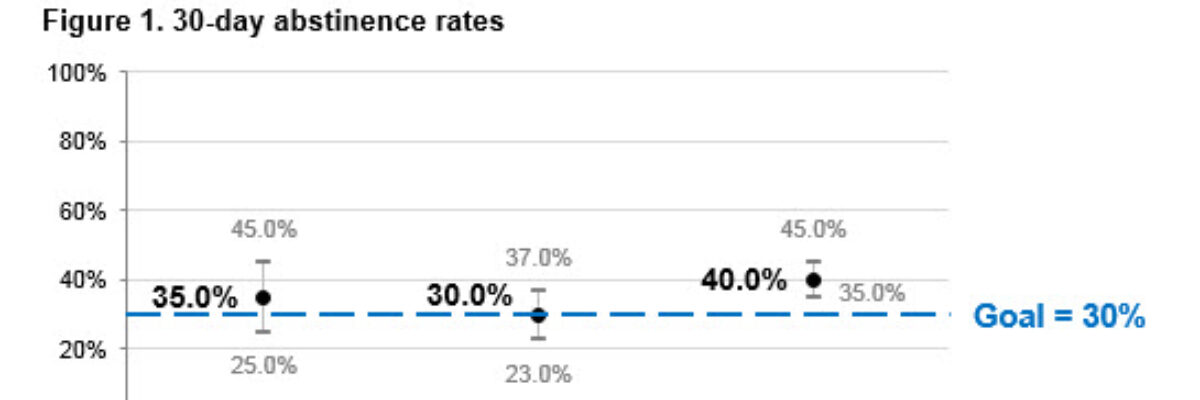
Hi there! I’m Angie Ficek and I’m a program evaluator at a small evaluation consulting firm called Professional Data Analysts, Inc. (PDA) in Minneapolis, MN. In a previous post, Stephanie wrote about adding standard deviations to a dataviz. I responded to her post with an example of…
Adding a Benchmark Line to a Graph
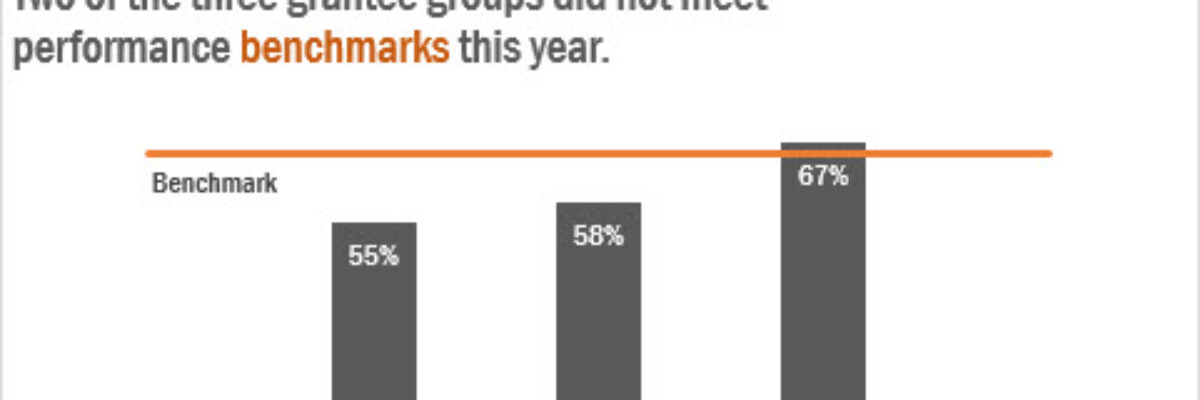
This simple line packs so much power. Adding a benchmark line to a graph gives loads of context for the viewer. Here’s how to make one right inside Excel. It’s so easy you might pass out. My data table looks like this: I have my data and I have the benchmark…
How to Make Horizontal Dumbbell Dot Plots in Excel
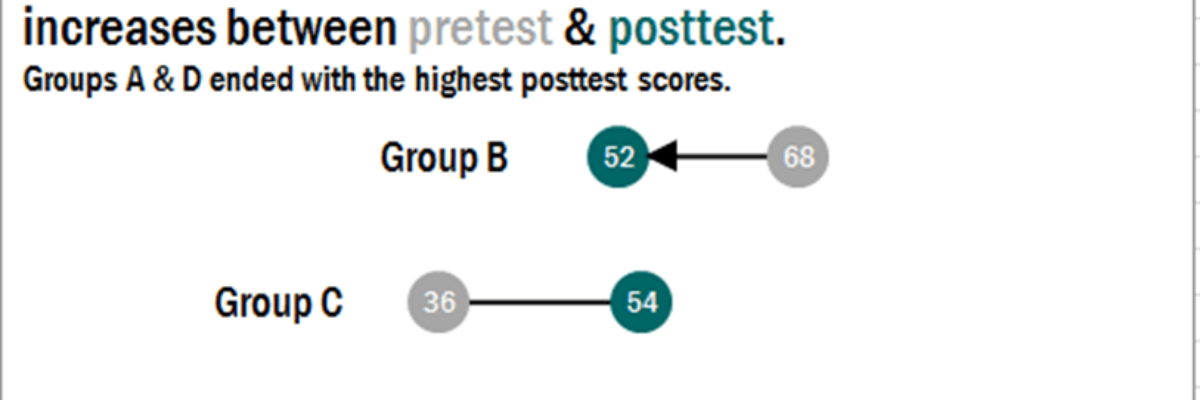
In case it wasn’t clear, I freakin love dot plots. They are amazingly easy to read, beautifully simple in their display. I was making these babies for some clients a little while ago, before and after dots for about 25 variables in one graph.
Labels are Used Sparingly
This post is about how to avoid inducing claustrophobia in your data visualizations. Too much text on a graph clutters it up, making readers feel suffocated. So let’s address the checklist item Labels are used sparingly. Sometimes, too much text isn’t the issue. Take…
How to Rock the Text in your Data Visualization
Very recently, Ann Emery and I released the Data Visualization Checklist. It’s thorough and its going to help your data visualization kick some serious ass. In these subsequent posts on each of our blogs, Ann and I will illustrate some of the checklist items to…
